


Steve Pitts
-
Posts
19 -
Joined
-
Last visited
-
Days Won
1
Posts posted by Steve Pitts
-
-
Folks,
Running v2.5.1.3062 of Scanner on a fully patched Windows Storage Server 2012 R2 Essentials system.
A couple of weekends ago the system disk in my Thecus W5000 box died without warning. After much fun and games I eventually succeeded in bringing the system back to life with a BMR from the last backup before the failure but once I got around to checking the status of the various components (I run both Drivepool and Scanner on this system) it became apparent that Scanner had apparently not noticed that the system disk had changed from the 500GB Seagate SSHD that Thecus supply in the base system to a 500GB Samsung SSD. It is still showing in the Essentials dashboard SCANNER page as Healthy and last checked on 16th September:
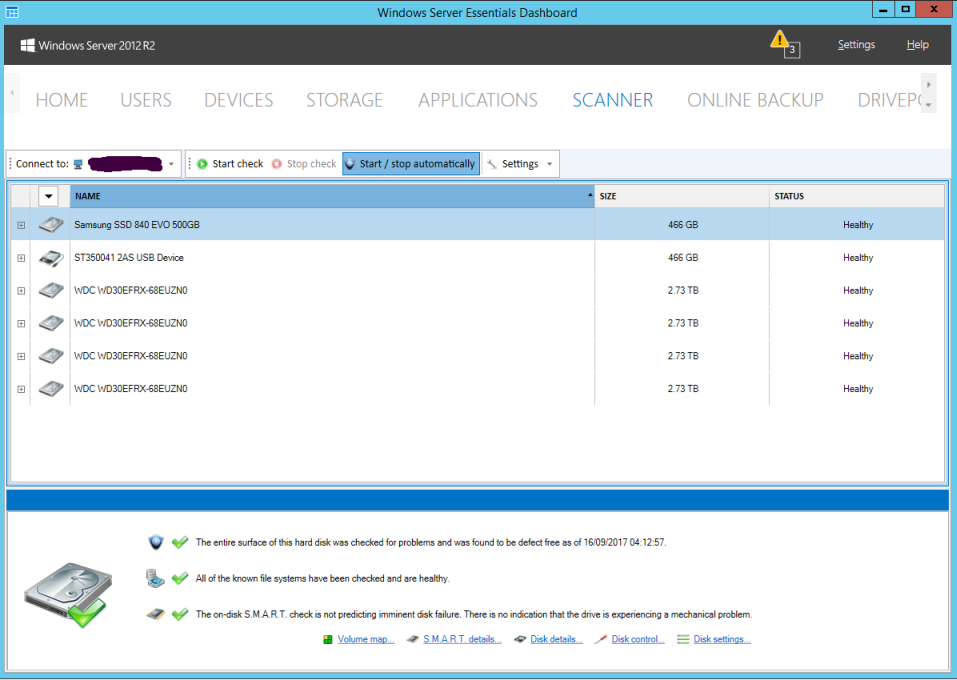
Is this working as designed inasmuch as the BMR has also reapplied some identifier to the disk that makes Scanner think it is the same device?? If not, what further information do you need to assist with troubleshooting this?? (I've captured the current contents of the ErrorReports and Logs directories in a ZIP archive, but that is 8.5 meg so I don't want to waste time and space uploading it somewhere if it isn't useful)
-
I can't work out whether what I'm seeing is an occurrence of this issue or just something similar. I am using FreeFileSync to copy from a Windows 7 64-bit system (not running DrivePool) to a Windows Storage Server 2012 R2 Essentials 64-bit box running DrivePool v2.2.0.651 and where the target location is on the pooled drive. One file was failing with error code 1450 (Insufficient system resources exist to complete the requested service) and nothing I could do would eliminate that error. All other files copied across fine and to add to the mystery when I manually copied the affected file to a Windows 8.1 64-bit system and synchronised it with the same network location on the WSS 2012 box the error did not occur and the copy completed normally (thus eliminating the issue, this time).
-
Did you ever figure this one out?? I have exactly the same issue but I am fairly convinced that it isn't DrivePool but rather that it's a network related issue because a) if I move the music files to a drive not in the pool then the same problem occurs and b ) if I use iperf to test the network without involving the disks I see similar issues with pauses as long as eight or nine seconds when no data is transmitted between the server and the client.the music just stops playing in between for 3-4 seconds because the Pool is not able to keep with the reads
-
Having installed the latest beta version (or at least, the one linked to above) do I need to re-run the verifier process or does that stick??
-
Folks,
I have had another crash with pretty much identical details (the addresses change, obviously, but the rest of the WinDbg output was unchanged) just 24 hours after the last one. Is it worth me uploading that dump file too??
FWIW both crashes seemed to be initiated by trying to access a file in one of the ServerFolders that are marked for duplication (some are, some aren't). A lot of the file access on this box is to folders that are not duplicated (eg. client backups, my music collection) but there is also regular access to folders that are (eg. file history backups)
-
Well, I turned the drive verifier on a day or two after my last post, whilst still running 2.2.0.599, and yesterday evening I got the following crash:
Microsoft (R) Windows Debugger Version 6.3.9600.17298 AMD64
Copyright (c) Microsoft Corporation. All rights reserved.


Loading Dump File [C:\Windows\MEMORY.DMP]
Kernel Bitmap Dump File: Only kernel address space is available


************* Symbol Path validation summary **************
Response                         Time (ms)     Location
Deferred                                       SRV*d:\symbols*http://msdl.microsoft.com/download/symbols
Symbol search path is: SRV*d:\symbols*http://msdl.microsoft.com/download/symbols
Executable search path is:
Windows 8 Kernel Version 9600 MP (4 procs) Free x64
Product: LanManNt, suite: TerminalServer SingleUserTS
Built by: 9600.17736.amd64fre.winblue_r9.150322-1500
Machine Name:
Kernel base = 0xfffff800`79e8e000 PsLoadedModuleList = 0xfffff800`7a167850
Debug session time: Thu Jul  2 22:11:51.301 2015 (UTC + 1:00)
System Uptime: 10 days 2:25:51.859
Loading Kernel Symbols
...............................................................
................................................................
.............................
Loading User Symbols

Loading unloaded module list
...........
*******************************************************************************
*                                                                             *
*                        Bugcheck Analysis                                    *
*                                                                             *
*******************************************************************************

Use !analyze -v to get detailed debugging information.

BugCheck CC, {ffffcf804aca4fe0, 0, fffff80079f43994, 0}

*** ERROR: Module load completed but symbols could not be loaded for covefs.sys
Probably caused by : covefs.sys ( covefs+c924 )

Followup: MachineOwner
---------

3: kd> !analyze -v
*******************************************************************************
*                                                                             *
*                        Bugcheck Analysis                                    *
*                                                                             *
*******************************************************************************

PAGE_FAULT_IN_FREED_SPECIAL_POOL (cc)
Memory was referenced after it was freed.
This cannot be protected by try-except.
When possible, the guilty driver's name (Unicode string) is printed on
the bugcheck screen and saved in KiBugCheckDriver.
Arguments:
Arg1: ffffcf804aca4fe0, memory referenced
Arg2: 0000000000000000, value 0 = read operation, 1 = write operation
Arg3: fffff80079f43994, if non-zero, the address which referenced memory.
Arg4: 0000000000000000, Mm internal code.

Debugging Details:
------------------


READ_ADDRESS: unable to get nt!MmNonPagedPoolStart
unable to get nt!MmSizeOfNonPagedPoolInBytes
 ffffcf804aca4fe0

FAULTING_IP:
nt!KeSetEvent+14
fffff800`79f43994 f6017f          test    byte ptr [rcx],7Fh

MM_INTERNAL_CODE:  0

DEFAULT_BUCKET_ID:  WIN8_DRIVER_FAULT

BUGCHECK_STR:  0xCC

PROCESS_NAME:  System

CURRENT_IRQL:  0

ANALYSIS_VERSION: 6.3.9600.17298 (debuggers(dbg).141024-1500) amd64fre

TRAP_FRAME:  ffffd0002067c0d0 -- (.trap 0xffffd0002067c0d0)
NOTE: The trap frame does not contain all registers.
Some register values may be zeroed or incorrect.
rax=0000000000000000 rbx=0000000000000000 rcx=ffffcf804aca4fe0
rdx=0000000000000001 rsi=0000000000000000 rdi=0000000000000000
rip=fffff80079f43994 rsp=ffffd0002067c260 rbp=ffffcf8056e00ca0
 r8=0000000000000000  r9=ffffe000ea8c3d48 r10=0000000000000000
r11=ffffe000ea8c3d48 r12=0000000000000000 r13=0000000000000000
r14=0000000000000000 r15=0000000000000000
iopl=0         nv up ei pl zr na po nc
nt!KeSetEvent+0x14:
fffff800`79f43994 f6017f          test    byte ptr [rcx],7Fh ds:ffffcf80`4aca4fe0=??
Resetting default scope

LAST_CONTROL_TRANSFER:  from fffff8007a00e05e to fffff80079fdeca0

STACK_TEXT:
ffffd000`2067be68 fffff800`7a00e05e : 00000000`00000050 ffffcf80`4aca4fe0 00000000`00000000 ffffd000`2067c0d0 : nt!KeBugCheckEx
ffffd000`2067be70 fffff800`79ee1839 : 00000000`00000000 ffffe000`e5653900 ffffd000`2067c0d0 00000000`00000000 : nt! ?? ::FNODOBFM::`string'+0x1ee9e
ffffd000`2067bf10 fffff800`79fe8f2f : 00000000`00000000 ffffe000`ec4d8110 ffffd001`b55b4100 ffffd000`00001f80 : nt!MmAccessFault+0x769
ffffd000`2067c0d0 fffff800`79f43994 : 00000000`00000000 fffff800`79f56dec ffffd000`20677000 ffffd000`2067d000 : nt!KiPageFault+0x12f
ffffd000`2067c260 fffff800`e5d30924 : ffffe000`ec4d8110 ffffcf80`00000001 ffffcf80`00000000 ffffd000`2067c468 : nt!KeSetEvent+0x14
ffffd000`2067c320 fffff800`e5d3e643 : ffffcf80`56e00ca0 ffffcf80`47b1cf70 ffffd000`2067c480 ffffd000`2067c418 : covefs+0xc924
ffffd000`2067c3d0 fffff800`7a5082ec : 00000000`00000000 ffffcf80`56e00ca0 ffffcf80`47b1cf70 ffffcf80`56e00f68 : covefs+0x1a643
ffffd000`2067c4a0 fffff800`79f4603a : ffffcf80`56e00ca0 00000000`00000001 ffffd000`2067c600 ffffc001`0b7d6140 : nt!IovpLocalCompletionRoutine+0x174
ffffd000`2067c500 fffff800`7a507b6f : ffffe000`ec82d201 ffffcf80`56e00c01 ffffd000`2067cb80 ffffe000`ebe0cdc8 : nt!IopfCompleteRequest+0x2ea
ffffd000`2067c640 fffff800`e50406a5 : 00000000`00000003 ffffe000`ebe0cc48 ffffcf80`56e00f68 ffffcf80`56e00ca0 : nt!IovCompleteRequest+0x1d7
ffffd000`2067c710 fffff800`e50f9559 : ffffd000`2067cb80 ffffc001`15b88610 00000000`00000000 00000000`00000000 : Ntfs!NtfsExtendedCompleteRequestInternal+0x135
ffffd000`2067c750 fffff800`e5114652 : ffffcf80`56e00ca0 00000000`00000000 ffffe000`e6fb1030 00000000`00000001 : Ntfs!NtfsQueryDirectory+0x2180
ffffd000`2067cb00 fffff800`e502ed7d : 00000000`00000000 ffffe000`ebe0cc48 ffffe000`ebe0cc48 ffffe000`ea8c3700 : Ntfs!NtfsCommonDirectoryControl+0xa2
ffffd000`2067cb40 fffff800`79f3b6bc : fffff800`7a2d3008 fffff800`e502ebb8 ffffe000`ea8c3600 fffff800`7a140340 : Ntfs!NtfsFspDispatch+0x1c5
ffffd000`2067cc90 fffff800`79f8e36c : 00000000`00000100 ffffe000`ea8c3600 00000000`00000080 ffffe000`ea8c3600 : nt!ExpWorkerThread+0x28c
ffffd000`2067cd40 fffff800`79fe52c6 : ffffd001`b55b4180 ffffe000`ea8c3600 ffffd001`b55c02c0 ffffe000`eb102aa8 : nt!PspSystemThreadStartup+0x58
ffffd000`2067cda0 00000000`00000000 : ffffd000`2067d000 ffffd000`20677000 00000000`00000000 00000000`00000000 : nt!KiStartSystemThread+0x16


STACK_COMMAND:  kb

FOLLOWUP_IP:
covefs+c924
fffff800`e5d30924 488b8424d0000000 mov     rax,qword ptr [rsp+0D0h]

SYMBOL_STACK_INDEX:  5

SYMBOL_NAME:  covefs+c924

FOLLOWUP_NAME:  MachineOwner

MODULE_NAME: covefs

IMAGE_NAME:  covefs.sys

DEBUG_FLR_IMAGE_TIMESTAMP:  54f0b618

FAILURE_BUCKET_ID:  0xCC_VRF_covefs+c924

BUCKET_ID:  0xCC_VRF_covefs+c924

ANALYSIS_SOURCE:  KM

FAILURE_ID_HASH_STRING:  km:0xcc_vrf_covefs+c924

FAILURE_ID_HASH:  {3be78ced-0bb9-61f2-b70e-f9eb3fa123df}

Followup: MachineOwner
---------

3: kd> .bugcheck
Bugcheck code 000000CC
Arguments ffffcf80`4aca4fe0 00000000`00000000 fffff800`79f43994 00000000`00000000
3: kd> kn
 # Child-SP          RetAddr           Call Site
00 ffffd000`2067be68 fffff800`7a00e05e nt!KeBugCheckEx
01 ffffd000`2067be70 fffff800`79ee1839 nt! ?? ::FNODOBFM::`string'+0x1ee9e
02 ffffd000`2067bf10 fffff800`79fe8f2f nt!MmAccessFault+0x769
03 ffffd000`2067c0d0 fffff800`79f43994 nt!KiPageFault+0x12f
04 ffffd000`2067c260 fffff800`e5d30924 nt!KeSetEvent+0x14
05 ffffd000`2067c320 fffff800`e5d3e643 covefs+0xc924
06 ffffd000`2067c3d0 fffff800`7a5082ec covefs+0x1a643
07 ffffd000`2067c4a0 fffff800`79f4603a nt!IovpLocalCompletionRoutine+0x174
08 ffffd000`2067c500 fffff800`7a507b6f nt!IopfCompleteRequest+0x2ea
09 ffffd000`2067c640 fffff800`e50406a5 nt!IovCompleteRequest+0x1d7
0a ffffd000`2067c710 fffff800`e50f9559 Ntfs!NtfsExtendedCompleteRequestInternal+0x135
0b ffffd000`2067c750 fffff800`e5114652 Ntfs!NtfsQueryDirectory+0x2180
0c ffffd000`2067cb00 fffff800`e502ed7d Ntfs!NtfsCommonDirectoryControl+0xa2
0d ffffd000`2067cb40 fffff800`79f3b6bc Ntfs!NtfsFspDispatch+0x1c5
0e ffffd000`2067cc90 fffff800`79f8e36c nt!ExpWorkerThread+0x28c
0f ffffd000`2067cd40 fffff800`79fe52c6 nt!PspSystemThreadStartup+0x58
10 ffffd000`2067cda0 00000000`00000000 nt!KiStartSystemThread+0x16
Yet again I've uploaded the dump in .7z format through the standard Box upload widget. I hope it helps. -
do you have any other programs installed
I have next to nothing installed:
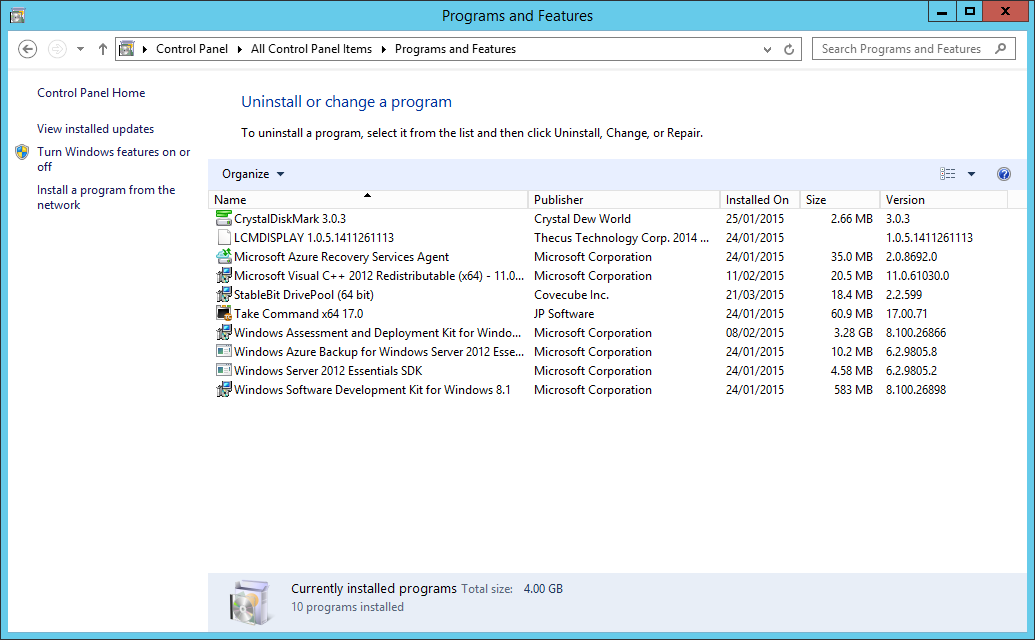
plus SysInternals, from which I have Process Explorer running most of the time the machine is up.
could you turn the driver verifier on?
I will give that a go when I get a chance.
-
Except that it won't install on R2 (the only available version is flagged as 8 RTM, although I tried to install it anyway) so that option is out.It's worth at least trying the hotfix
-
Well it might, but it reads like a bit of a fudge. Without understanding exactly what is causing this and why, it is difficult to say whether extending the timeout is going to help. However, it probably isn't going to do any harm either, so I'll install it anyway. Given that this issue has only happened twice in the four months I've been running DrivePool (I had my fingers crossed when I typed that to try and avoid the obvious jinx!?) it is going to be difficult to say whether a fix has had the desired effect or not.the hotfix listed previously may help
Yes. I ran Prime95, with three worker tasks, for over a week without any issues (other than a few strange log messages and alerts because the machine apparently couldn't keep up with all it had to do with just one half of one CPU to service it, which is probably no great surprise given the processor involved).have you tried CPU stress tests?
I wonder whether the ClockInterrupt stuff relates to the Thecus supplied LCMDISPLAY task, which updates the LCD panel on the front of the box. Given that it does so so badly (the information shown doesn't get updated between reboots!!) I may also try disabling that - I can't see the display without craning my neck under the desk anyway.
-
Which does not report any errors.the Windows Memory Diagnostics has an "extended test" option
The reason for the vagueness of my initial response to this relates not to the tools (I already have a bootable stick with a standalone version of memtest86+, plus UBCD, SystemRescueCD, Paragon's Hard Disk Manager, a variety of Linux live CDs and various manufacturer specific tools) but the fact that I've had difficulty getting the Thecus box to boot from USB sticks, to the extent that I went out and bought a USB DVD drive in order to rebuild the box a week or two after I first got it (and even that took several attempts to get it to boot). So I will try another memory tester once I've cut a CD/DVD with UBCD (or something similar) on it or figured a way to boot from a thumb drive.or memtest86 is a good idea (in fact, UBCD has this and a bunch of other utilities on it
Would you consider that to be a reasonable solution to this problem (that is not intended to be sarcastic, it is a serious question - you obviously have far more experience with these kinds of environments than I do, I'm a techie but I make a living from IBM mainframes not Wintel)?? My gut feeling is that it's the wrong answer, but I'm prepared to be convinced otherwise by more experienced counsel.you can disable the feature (as it may not be needed) by using this hotfix:
-
I seem to remember doing that last time, but will repeat the exercise and see if I can use something more thorough than the Windows Memory Diagnostics.could you run a memory test (just in case)?
Given the nature of the issue I am loathe to do that without some indication of a relevant fix. Assuming that this is another representation of the same issue then whatever mitigations Alex put in place last time obviously aren't sufficient to cover all cases.And use the newest build to see if it helps
-
Sadly not, as it turns out. Just had another occurrence of this today, running beta build 2.2.0.599 (as requested last time) on the same system, still fully up-to-date with Windows updates. I've uploaded the dump file (again as .7z format). Debugger output looks like this:For the specific BSOD that you had, yes, that will take care of the issue
Microsoft (R) Windows Debugger Version 6.3.9600.17298 AMD64 Copyright (c) Microsoft Corporation. All rights reserved. Loading Dump File [C:\Windows\MEMORY.DMP] Kernel Bitmap Dump File: Only kernel address space is available ************* Symbol Path validation summary ************** Response Time (ms) Location Deferred SRV*d:\symbols*http://msdl.microsoft.com/download/symbols Symbol search path is: SRV*d:\symbols*http://msdl.microsoft.com/download/symbols Executable search path is: Windows 8 Kernel Version 9600 MP (4 procs) Free x64 Product: LanManNt, suite: TerminalServer SingleUserTS Built by: 9600.17736.amd64fre.winblue_r9.150322-1500 Machine Name: Kernel base = 0xfffff802`ac616000 PsLoadedModuleList = 0xfffff802`ac8ef850 Debug session time: Fri May 1 07:30:14.463 2015 (UTC + 1:00) System Uptime: 15 days 22:17:59.324 Loading Kernel Symbols ............................................................... ................................................................ .............................. Loading User Symbols Loading unloaded module list ........... ******************************************************************************* * * * Bugcheck Analysis * * * ******************************************************************************* Use !analyze -v to get detailed debugging information. BugCheck 133, {1, 1e00, 0, 0} *** ERROR: Module load completed but symbols could not be loaded for covefs.sys Probably caused by : covefs.sys ( covefs+d95c ) Followup: MachineOwner --------- 0: kd> !analyze -v ******************************************************************************* * * * Bugcheck Analysis * * * ******************************************************************************* DPC_WATCHDOG_VIOLATION (133) The DPC watchdog detected a prolonged run time at an IRQL of DISPATCH_LEVEL or above. Arguments: Arg1: 0000000000000001, The system cumulatively spent an extended period of time at DISPATCH_LEVEL or above. The offending component can usually be identified with a stack trace. Arg2: 0000000000001e00, The watchdog period. Arg3: 0000000000000000 Arg4: 0000000000000000 Debugging Details: ------------------ OVERLAPPED_MODULE: Address regions for 'FsDepends' and 'WUDFRd.sys' overlap DPC_TIMEOUT_TYPE: DPC_QUEUE_EXECUTION_TIMEOUT_EXCEEDED DEFAULT_BUCKET_ID: WIN8_DRIVER_FAULT BUGCHECK_STR: 0x133 PROCESS_NAME: System CURRENT_IRQL: d ANALYSIS_VERSION: 6.3.9600.17298 (debuggers(dbg).141024-1500) amd64fre LAST_CONTROL_TRANSFER: from fffff802ac781f7e to fffff802ac766ca0 STACK_TEXT: fffff802`adbccc88 fffff802`ac781f7e : 00000000`00000133 00000000`00000001 00000000`00001e00 00000000`00000000 : nt!KeBugCheckEx fffff802`adbccc90 fffff802`ac652f67 : 00000000`00000000 00000000`00000000 00000000`00000001 ffffe001`00000000 : nt! ?? ::FNODOBFM::`string'+0xadbe fffff802`adbccd20 fffff802`acdb267f : 00000000`00000001 fffff802`ac6ed143 fffff802`acdfe9b0 00000000`00000001 : nt!KeClockInterruptNotify+0x787 fffff802`adbccf40 fffff802`ac6ed143 : fffff802`acdfe900 ffffd000`213cc2b0 00000000`00000000 00000000`00000001 : hal!HalpTimerClockInterrupt+0x4f fffff802`adbccf70 fffff802`ac76812a : fffff802`acdfe900 fffff802`ac919180 00000000`00000000 ffffc000`14529b00 : nt!KiCallInterruptServiceRoutine+0xa3 fffff802`adbccfb0 fffff802`ac76850f : 00000000`05a59400 ffffe001`53d7b2e0 fffff802`ac919180 00000000`0000000f : nt!KiInterruptSubDispatchNoLockNoEtw+0xea ffffd000`213cc230 fffff802`ac6cc362 : 00000000`0000008b ffffe001`56857e70 ffffe001`56857ea0 ffffd000`22003038 : nt!KiInterruptDispatchLBControl+0x11f ffffd000`213cc3c0 fffff801`01b0e95c : ffffe001`00000000 ffffd000`00000001 ffffe001`5a4e9400 fffff801`01b0ea93 : nt!KeSetEvent+0x9e2 ffffd000`213cc480 fffff801`01b1b40c : ffffe001`5a4e9470 ffffe001`54ade290 ffffe001`5d6e7018 00000000`00000001 : covefs+0xd95c ffffd000`213cc500 fffff802`ac6ce03a : 00000000`00000000 ffffe001`5a4e9470 ffffe001`54ade290 00000000`00000000 : covefs+0x1a40c ffffd000`213cc5d0 fffff801`00e536a5 : 00000000`00000001 ffffe001`5d6e7001 ffffd000`213ccb80 ffffe001`5d6e7198 : nt!IopfCompleteRequest+0x2ea ffffd000`213cc710 fffff801`00f0c559 : ffffd000`213ccb80 ffffc000`07f021a0 00000000`00000000 00000000`00000000 : Ntfs!NtfsExtendedCompleteRequestInternal+0x135 ffffd000`213cc750 fffff801`00f27652 : ffffe001`5a4e9470 00000000`00000000 ffffe001`5324f030 00000000`00000001 : Ntfs!NtfsQueryDirectory+0x2180 ffffd000`213ccb00 fffff801`00e41d7d : 00000000`00000000 ffffe001`5d6e7018 ffffe001`5d6e7018 ffffe001`5d21a140 : Ntfs!NtfsCommonDirectoryControl+0xa2 ffffd000`213ccb40 fffff802`ac6c36bc : ffffe001`5d21a040 fffff801`00e41bb8 ffffe001`5d21a040 fffff802`ac8c8340 : Ntfs!NtfsFspDispatch+0x1c5 ffffd000`213ccc90 fffff802`ac71636c : ffffd000`00000001 ffffe001`5d21a040 00000000`00000080 ffffe001`5d21a040 : nt!ExpWorkerThread+0x28c ffffd000`213ccd40 fffff802`ac76d2c6 : fffff802`ac919180 ffffe001`5d21a040 ffffe001`5332e880 ffffe001`00000000 : nt!PspSystemThreadStartup+0x58 ffffd000`213ccda0 00000000`00000000 : ffffd000`213cd000 ffffd000`213c7000 00000000`00000000 00000000`00000000 : nt!KiStartSystemThread+0x16 STACK_COMMAND: kb FOLLOWUP_IP: covefs+d95c fffff801`01b0e95c 48837c242000 cmp qword ptr [rsp+20h],0 SYMBOL_STACK_INDEX: 8 SYMBOL_NAME: covefs+d95c FOLLOWUP_NAME: MachineOwner MODULE_NAME: covefs IMAGE_NAME: covefs.sys DEBUG_FLR_IMAGE_TIMESTAMP: 54f0b618 FAILURE_BUCKET_ID: 0x133_ISR_covefs+d95c BUCKET_ID: 0x133_ISR_covefs+d95c ANALYSIS_SOURCE: KM FAILURE_ID_HASH_STRING: km:0x133_isr_covefs+d95c FAILURE_ID_HASH: {16786431-5e9f-ea51-238f-5f4166303696} Followup: MachineOwner --------- 0: kd> .bugcheck Bugcheck code 00000133 Arguments 00000000`00000001 00000000`00001e00 00000000`00000000 00000000`00000000 -
Using 'dir /o:n' resolves the issue in cmd.exe and doesn't rely on any default behaviour (which has changed between releases of Windows). Of course it means changing your batch files but that is a one time hit.
-
Apologies for jumping in here, but this doesn't seem worthy of its own thread. Is there any way of mapping the output from that command to the \device\harddisk... format that Microsoft use in some of their messages/event log entries (or vice versa, come to that)??run "cmd /k mountvol" and post the results?
-
Okay, current beta installed, fingers crossed that it solves the underlying issue

-
I seem to be cursed at the moment, because in trying to upload the file to my SkyDrive (or OneDrive, or whatever MS is calling the service this marketing period) I've discovered that the sync process is broken on my Windows 8.1 box and that Microsoft have removed the ability to use reparse points to map existing data into Sk1Drive {sigh} Anyway, as a result I had another try with the Box upload, using Firefox this time rather than Opera, and it looks like it has worked.No, it didn't look like the dump got uploaded properly.

{touch wood} this has only happened the once, thus far. I hope it doesn't become a regular occurrence because a) it took the Thecus over 20 minutes to complete the dump collection and reboot process andAnd was this a one time thing, or has it happened a few times?
 whilst the server was down none of my other systems had connectivity to the outside world, even when I tweaked their DNS settings (looks like I need to investigate the DNS set up on the server - silly me assumed that the Essentials in the name meant that it would do all of the essential stuff for me). I am loathe to use the beta version before you folk have checked the problem to know whether or not the latest version includes a fix for whatever caused the bumpy landing.
-
Folks,
I left the Upload running overnight, despite the file being only 80MB and having roughly 6Mbs upstream, but it is still showing as 'Uploading...' this morning. Did the file arrive?? If not, I'll upload it to my SkyDrive and send a link through your Contact Us page.
-
Folks,
Running DrivePool v2.1.1.561 on a Thecus W5000 with a fully patched Windows Storage Server 2012 R2 Essentials and received my first BSOD (the new, less useful, pastel blue screen). Checking the dump using WINDBG I see the finger pointed at covefs.sys and therefore my first post here is for a potential bug, which is a shame but the nature of support forums.
The results of my limited interactions with the debugger are:
Loading Dump File [C:\Windows\MEMORY.DMP]
Kernel Bitmap Dump File: Only kernel address space is available


************* Symbol Path validation summary **************
Response Time (ms) Location
Deferred SRV*d:\symbols*http://msdl.microsoft.com/download/symbols
Symbol search path is: SRV*d:\symbols*http://msdl.microsoft.com/download/symbols
Executable search path is:
Windows 8 Kernel Version 9600 MP (4 procs) Free x64
Product: LanManNt, suite: TerminalServer SingleUserTS
Built by: 9600.17668.amd64fre.winblue_r8.150127-1500
Machine Name:
Kernel base = 0xfffff802`3b017000 PsLoadedModuleList = 0xfffff802`3b2f0250
Debug session time: Tue Mar 17 21:38:39.888 2015 (UTC + 0:00)
System Uptime: 6 days 12:44:33.719
Loading Kernel Symbols
...............................................................
................................................................
..............................
Loading User Symbols

Loading unloaded module list
...........
*******************************************************************************
* *
* Bugcheck Analysis *
* *
*******************************************************************************

Use !analyze -v to get detailed debugging information.

BugCheck 133, {1, 1e00, 0, 0}

*** ERROR: Module load completed but symbols could not be loaded for covefs.sys
Probably caused by : covefs.sys ( covefs+c813 )

Followup: MachineOwner
---------

3: kd> !analyze -v
*******************************************************************************
* *
* Bugcheck Analysis *
* *
*******************************************************************************

DPC_WATCHDOG_VIOLATION (133)
The DPC watchdog detected a prolonged run time at an IRQL of DISPATCH_LEVEL
or above.
Arguments:
Arg1: 0000000000000001, The system cumulatively spent an extended period of time at
DISPATCH_LEVEL or above. The offending component can usually be
identified with a stack trace.
Arg2: 0000000000001e00, The watchdog period.
Arg3: 0000000000000000
Arg4: 0000000000000000

Debugging Details:
------------------


DPC_TIMEOUT_TYPE: DPC_QUEUE_EXECUTION_TIMEOUT_EXCEEDED

DEFAULT_BUCKET_ID: WIN8_DRIVER_FAULT

BUGCHECK_STR: 0x133

PROCESS_NAME: System

CURRENT_IRQL: d

ANALYSIS_VERSION: 6.3.9600.17298 (debuggers(dbg).141024-1500) amd64fre

LAST_CONTROL_TRANSFER: from fffff8023b18a490 to fffff8023b1679a0

STACK_TEXT:
ffffd000`bac77c88 fffff802`3b18a490 : 00000000`00000133 00000000`00000001 00000000`00001e00 00000000`00000000 : nt!KeBugCheckEx
ffffd000`bac77c90 fffff802`3b06a2c1 : ffffe000`f8600700 00000000`02270c6e 00000000`00000000 ffffe000`f89e3a00 : nt! ?? ::FNODOBFM::`string'+0x125e0
ffffd000`bac77d20 fffff802`3b7b37b5 : ffffc001`6ed98b00 ffffd000`22c0c4c8 00000000`00000000 00000000`00000001 : nt!KeClockInterruptNotify+0x91
ffffd000`bac77f40 fffff802`3b0fceb3 : ffffd000`22c0c340 fffff802`3b117af3 00000000`00000000 00000000`00000000 : hal!HalpTimerClockIpiRoutine+0x15
ffffd000`bac77f70 fffff802`3b168e2a : ffffe000`f8600700 ffffd000`22c0c4c8 00000000`00000000 ffffc001`6ed98b00 : nt!KiCallInterruptServiceRoutine+0xa3
ffffd000`bac77fb0 fffff802`3b16920f : ffffe000`f8446180 00000000`bbd85590 ffffd000`22c0c4c8 fffff802`3b066c96 : nt!KiInterruptSubDispatchNoLockNoEtw+0xea
ffffd000`22c0c2c0 fffff802`3b04e153 : ffffc001`6978e1e2 00000000`00000000 ffffc001`6ed98b00 00000000`00000001 : nt!KiInterruptDispatchLBControl+0x11f
ffffd000`22c0c450 fffff801`3590e813 : ffffe000`fbd24330 ffffd000`22c0c6d0 ffffe000`fbd24330 fffff801`3590ea73 : nt!KxWaitForLockOwnerShip+0x27
ffffd000`22c0c480 fffff801`3591b6bc : ffffe000`fbd24330 ffffe000`f9112bd0 ffffe000`fe1e0018 00000000`00000001 : covefs+0xc813
ffffd000`22c0c500 fffff802`3b0b836a : 00000000`00000000 ffffe000`fbd24330 ffffe000`f9112bd0 fffff802`3b0769de : covefs+0x196bc
ffffd000`22c0c5d0 fffff801`34c506a5 : 00000000`00000001 ffffe000`fe1e0001 ffffd000`22c0cb80 ffffe000`fe1e0198 : nt!IopfCompleteRequest+0x2ea
ffffd000`22c0c710 fffff801`34d09559 : ffffd000`22c0cb80 ffffc001`6eba9670 00000000`00000000 00000000`00000000 : Ntfs!NtfsExtendedCompleteRequestInternal+0x135
ffffd000`22c0c750 fffff801`34d24652 : ffffe000`fbd24330 00000000`00000000 ffffe000`f8446030 00000000`00000001 : Ntfs!NtfsQueryDirectory+0x2180
ffffd000`22c0cb00 fffff801`34c3ed7d : 00000000`00000000 ffffe000`fe1e0018 ffffe000`fe1e0018 ffffe000`fdb37140 : Ntfs!NtfsCommonDirectoryControl+0xa2
ffffd000`22c0cb40 fffff802`3b0c23ac : fffff802`3b0bfa60 fffff801`34c3ebb8 ffffe000`fdb37040 fffff802`3b2c9300 : Ntfs!NtfsFspDispatch+0x1c5
ffffd000`22c0cc90 fffff802`3b0ef280 : 00000000`00000000 ffffe000`fdb37040 00000000`00000080 ffffe000`fdb37040 : nt!ExpWorkerThread+0x28c
ffffd000`22c0cd40 fffff802`3b16dfc6 : ffffd000`b71c0180 ffffe000`fdb37040 ffffd000`b71cc2c0 00000000`00000000 : nt!PspSystemThreadStartup+0x58
ffffd000`22c0cda0 00000000`00000000 : ffffd000`22c0d000 ffffd000`22c07000 00000000`00000000 00000000`00000000 : nt!KiStartSystemThread+0x16


STACK_COMMAND: kb

FOLLOWUP_IP:
covefs+c813
fffff801`3590e813 90 nop

SYMBOL_STACK_INDEX: 8

SYMBOL_NAME: covefs+c813

FOLLOWUP_NAME: MachineOwner

MODULE_NAME: covefs

IMAGE_NAME: covefs.sys

DEBUG_FLR_IMAGE_TIMESTAMP: 53935b14

FAILURE_BUCKET_ID: 0x133_ISR_covefs+c813

BUCKET_ID: 0x133_ISR_covefs+c813

ANALYSIS_SOURCE: KM

FAILURE_ID_HASH_STRING: km:0x133_isr_covefs+c813

FAILURE_ID_HASH: {bb6e4205-c311-4323-ca4f-d3d109d19a07}

Followup: MachineOwner
---------

3: kd> .bugcheck
Bugcheck code 00000133
Arguments 00000000`00000001 00000000`00001e00 00000000`00000000 00000000`00000000
3: kd> kn
# Child-SP RetAddr Call Site
00 ffffd000`bac77c88 fffff802`3b18a490 nt!KeBugCheckEx
01 ffffd000`bac77c90 fffff802`3b06a2c1 nt! ?? ::FNODOBFM::`string'+0x125e0
02 ffffd000`bac77d20 fffff802`3b7b37b5 nt!KeClockInterruptNotify+0x91
03 ffffd000`bac77f40 fffff802`3b0fceb3 hal!HalpTimerClockIpiRoutine+0x15
04 ffffd000`bac77f70 fffff802`3b168e2a nt!KiCallInterruptServiceRoutine+0xa3
05 ffffd000`bac77fb0 fffff802`3b16920f nt!KiInterruptSubDispatchNoLockNoEtw+0xea
06 ffffd000`22c0c2c0 fffff802`3b04e153 nt!KiInterruptDispatchLBControl+0x11f
07 ffffd000`22c0c450 fffff801`3590e813 nt!KxWaitForLockOwnerShip+0x27
08 ffffd000`22c0c480 fffff801`3591b6bc covefs+0xc813
09 ffffd000`22c0c500 fffff802`3b0b836a covefs+0x196bc
0a ffffd000`22c0c5d0 fffff801`34c506a5 nt!IopfCompleteRequest+0x2ea
0b ffffd000`22c0c710 fffff801`34d09559 Ntfs!NtfsExtendedCompleteRequestInternal+0x135
0c ffffd000`22c0c750 fffff801`34d24652 Ntfs!NtfsQueryDirectory+0x2180
0d ffffd000`22c0cb00 fffff801`34c3ed7d Ntfs!NtfsCommonDirectoryControl+0xa2
0e ffffd000`22c0cb40 fffff802`3b0c23ac Ntfs!NtfsFspDispatch+0x1c5
0f ffffd000`22c0cc90 fffff802`3b0ef280 nt!ExpWorkerThread+0x28c
10 ffffd000`22c0cd40 fffff802`3b16dfc6 nt!PspSystemThreadStartup+0x58
11 ffffd000`22c0cda0 00000000`00000000 nt!KiStartSystemThread+0x16
Fascinating stuff, I'm sure, but next to useless to me
 I've found instructions elsewhere on these forums, and therefore the dump (in 7Zip format) is uploading as I type this.

Change of physical drive apparently not detected
in General
Posted
Fair enough, although it does feel a bit daft when the manufacturer and description of the drive have fundamentally changed but the scanner sees it as the same disk.
I don't see exactly that form of words, only Mark all Readable blocks unchecked. Is that what you meant or am I looking in the wrong place?? Given that this drive is now due to be checked again in a few days I may decide not to bother anyway and just let it be checked on the schedule.